What effect has the Federal Reserve's previous Quantitative Easing (QE) programs had on the acceleration of private debt in the U.S. economy?
That's an important question to answer because of the remarkable correlation between the nation's real economic growth rate and the change in the rate of growth of private debt in the U.S., where periods of a rising real GDP growth rate are associated with a rising acceleration of private debt, and periods of falling real GDP growth are correlated with decelerating private debt.
In the chart below, we've visualized the periods in which the Fed's three major QE programs of recent years provide the backdrop against the trajectory of the acceleration of private debt and its trailing twelve month average. For reference, we've also indicated the period of the so-called "Great Recession", as determined by the National Bureau of Economic Research.
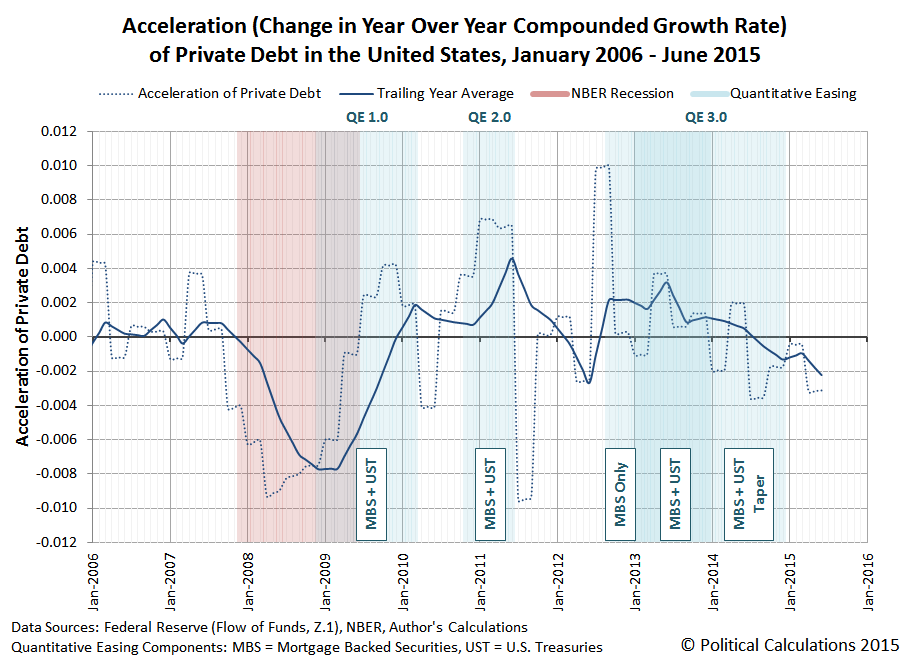
In the chart above, we've also identified the kinds of assets that the Federal Reserve's focused on purchasing during each of the major phases of its QE programs, Mortgage Backed Securites (MBS) and U.S. Treasuries (UST).
What we observe in the trailing year data is that the Fed's various QE programs have had a fairly clear "on-off" effect on changes in the rate of growth of private debt in the U.S. economy, which is especially evident for QE 1.0 and QE 2.0., with the acceleration of private debt being jerked upward coincidentally or soon after when the Fed's QE programs were turned "on", and jerked downward almost instantly when the applied impulse of QE was turned "off".
The results for QE 3.0 are different in that the Fed's asset buying programs were structured differently from its previous programs. Here, the acceleration of private debt received an immediate upward jerk as the Fed initially began only purchasing MBS assets, but when the Fed expanded its third QE program in January 2013 to include U.S. Treasuries, the upward jerk would appear to be somewhat delayed.
We suspect that apparent delay is due to the then-looming impact of the U.S. government's fiscal cliff crisis, which was prompted by the re-election of President Obama and the expectation that the very large tax hikes that he favored would into effect on 1 January 2013 as a consequence, which weighed down the acceleration of private debt going into the end of 2012.
The Fed, seeing the economic drag from those expectations, announced in December 2012 that it would expand its third QE program in Janaury 2013 to include U.S. Treasuries, which would compensate for the negative effects of those tax hikes on the weakened U.S. economy of late 2012. (The 2012 fiscal cliff crisis was resolved on 3 January 2013 with a compromise that raised tax rates, but to a lesser extent than would have otherwise, but not before the damage to the acceleration of private debt was done.)
After 2013, the Fed began steadily tapering its purchases of UST and MBS assets, which coincides with a generally decreasing acceleration for private debt in the U.S. economy, which has continued to fall fairly steadily since. Since August 2014, the level of acceleration of private debt in the U.S. has also been negative. Through June 2015, the trailing year average of private debt acceleration in the U.S. has not yet reached the levels where the Fed has launched its previous rounds of quantitative easing in its attempts to stimulate the debt-funded growth of the U.S. economy.
On a final side note, in previous posts, we've described the Fed's addition of U.S. Treasuries to its its third QE asset purchase program as QE 4.0, although in retrospect, it's really better understood as an expansion of QE 3.0. If you happen to come across older posts of ours (before 18 November 2015) where we reference QE 4.0, that's what we're referring to! Any reference of ours to QE 4.0 after 18 November 2015 would be with respect to a new QE program, which we would see as becoming more and more likely with the continued deceleration of the growth of private debt in the U.S. economy....
Data Sources
U.S. Federal Reserve. Data Download Program. Z.1 Statistical Release (Total Liabilities for All Sectors, Rest of the World, State and Local Governments Excluding Employee Retirement Funds, Federal Government). 1951Q4 - 2015Q2. [Online Database]. 18 September 2015. Accessed 28 October 2015.
National Bureau of Economic Research. U.S. Business Cycle Expansions and Contractions. [PDF Document]. Accessed 28 October 2015.
Labels: data visualization, debt, physics
Welcome to the blogosphere's toolchest! Here, unlike other blogs dedicated to analyzing current events, we create easy-to-use, simple tools to do the math related to them so you can get in on the action too! If you would like to learn more about these tools, or if you would like to contribute ideas to develop for this blog, please e-mail us at:
ironman at politicalcalculations
Thanks in advance!
Closing values for previous trading day.
This site is primarily powered by:
CSS Validation

RSS Site Feed
JavaScript
The tools on this site are built using JavaScript. If you would like to learn more, one of the best free resources on the web is available at W3Schools.com.
Other Cool Resources
Blog Roll


