After having a bad day on 15 April 2013, the stock market had a good day on 16 April 2013, as everything looked up. Wall St. Cheat Sheet's John Nyaradi captured the mood:
Among Tuesday’s three upbeat economic reports was the Federal Reserve revelation that industrial production rose by twice as much as expected.
Economists were expecting the U.S. Federal Reserve to report that industrial production increased by 0.2 percent in March. Investors were excited to see that industrial production actually increased by 0.4 percent. The reports on March housing starts and the Consumer Price Index were also better than expected.
Beyond that even, all the big earnings news of 16 April 2013 was good:
Now that earnings season is in full swing, investors are rightfully focusing the majority of their attention on what really matters: earnings reports. A number of the biggest companies reported today, and for the most part, the numbers look good. Positive results from Johnson & Johnson helped pull the health-care industry higher, while Goldman Sachs gave investors reason to believe in the financial industry.
With strong first-quarter results, the Dow Jones Industrial Average made a 180 from yesterday's 265-point drop and rose 157 points, or 1.08%, today. And after losing more than the Dow yesterday, the other major indexes gained more than the blue-chip average today, as the S&P 500 rose by 1.43% and the Nasdaq climbed higher by 1.5% today.
Those gains occurred in all sectors of the market.
But in all this good news, there was an important thing that didn't happen. Not one of these companies reporting such good earnings acted to boost their dividends. That's a crucial missing action that undermined the previous day's run-up in stock prices, because if they thought that the good times were going to go on, some of those great earnings would be converted into cash to benefit their shareholders.
And so, investors looking further forward into the future were left with the picture where there will be a large deceleration in the growth rate of dividends, which directly translates into a negative acceleration for stock prices. Which we certainly saw on 17 April 2013:
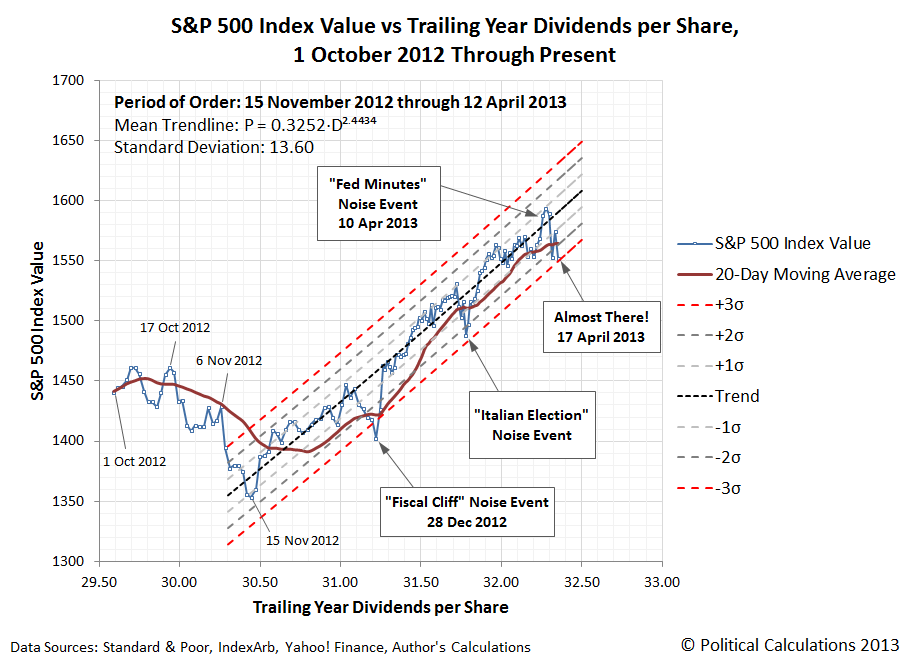
If you've been following our recent posts that have featured this chart, having stock prices for the S&P 500 close below the bottom red-dashed line would be a "sell signal", as it would indicate that order in the market is breaking down. (Please note that we have adjusted the period of order shown in the chart to conclude with 12 April 2013 - the last trading day before the recent outbreak of volatility.)
We should also recognize that since we're using both a power law-based regression analysis and a statistics-based approach to define these curves, there is a possibility that data points falling outside the red-dashed curves could be outliers for the established trend, rather than an indication that a state of order in the market has broken down. A more conservative approach for making a decision to sell in these circumstances would be to wait for the 20-day moving average of stock prices to fall outside the "normal" range for stock prices with respect to their trailing year dividends per share, which would be a confirmation that a previous state of relative order in the market has ended.
Speaking of which, much of the recent rally in stock prices (aka "the previous state of relative order in the market") was actually powered by changes in how many companies will be paying their top employees rather than by a rapidly improving business outlook for U.S. companies, which has apparently fooled a lot of investors. Here, many companies have really been acting to shift money that might have been paid to their highest earners in the form of wages and salaries to instead be paid out in the form of dividends, helping to keep them from being as negatively impacted by President Obama's higher income tax rates that took effect at the beginning of the year than they might have otherwise. Stock prices largely rose in response as investors also benefit from these kinds of changes in the employee compensation strategies of many corporations.
For serious market observers, the good news is that with most of this tax avoidance-driven activity now complete following the end of the first quarter of 2013, dividends are once again more accurately reflecting the business outlook for the private sector in the U.S.
On the Lighter Side
Finally, here are some fun items following a bleak day. First, for those who pay close attention to the comments we put in the margins of our favorite chart, there is now an open call for the Federal Reserve to amp up its latest quantitative easing program. We guess that only buying $85 billion per month worth of Mortgage-Based Securities (MBS) and U.S. Treasuries isn't enough to prop up the economy anymore.
Second, don't miss CNBC's executive news editor Patti Domm's article "Scary Pattern Could Be Forming on S&P 500 Chart". Knowing the state of the mainstream media these days, and at NBC-affiliated "news" organizations in particular, it's probably a serious piece of financial news reporting, but we couldn't stop laughing while reading it!
Third, have you ever heard of the DeMark 9 indicator? Well, neither had we until yesterday, but then it would also seem to be indicating that the market is on the verge of sending a rare sell signal, so the thing we just threw together a few weeks ago isn't the only game in town!
But that isn't the end of the story. CNBC is also wondering if a market sell signal could be near, based the kind of "highly informative" interview that we've come to expect from all NBC "news" outlets....
Labels: chaos, SP 500, stock market
Welcome to the blogosphere's toolchest! Here, unlike other blogs dedicated to analyzing current events, we create easy-to-use, simple tools to do the math related to them so you can get in on the action too! If you would like to learn more about these tools, or if you would like to contribute ideas to develop for this blog, please e-mail us at:
ironman at politicalcalculations
Thanks in advance!
Closing values for previous trading day.
This site is primarily powered by:
CSS Validation

RSS Site Feed
JavaScript
The tools on this site are built using JavaScript. If you would like to learn more, one of the best free resources on the web is available at W3Schools.com.
Other Cool Resources
Blog Roll


