The chart to the right shows the percentage of June 2006's total employment figures for the Age 16-19, Age 20+ and the combined total (Age 16+) U.S. workforce. We see that teen employment began plunging well before total employment in the U.S. economy peaked in November 2007, which we've previously demonstrated to be the direct result of increases in the U.S. federal minimum wage. We can see that as a percentage of each age group's June 2006 total employment levels, teens continued to be far more likely to be the ones affected as the U.S. economy officially entered into recession in December 2007 until November 2008, when the teen job population appears to have stabilized at roughly 83.1% of its June 2006 figure. Meanwhile, we observe that the decline in the employment situation for those Age 20+ has accelerated.

Here, we see that up until July 2008, teens were clearly bearing the brunt of job losses in the U.S. economy. However, beginning with August 2008, significant job losses expanded into the adult working population of the United States, while teen employment levels have tended to stabilize.
What drove these job losses for the Age 20+ working population of the U.S. is the aftermath of the spike in oil prices in 2008. Here, gasoline prices rose sharply through 2008 until peaking at a national average price per gallon of $4.164 in July 2008, an all-time record even when adjusting for inflation. This sharp increase in prices drove U.S. consumers to significantly change their consumption of anything whose cost of production or of operating is closely linked to the price of oil, such as automobiles.
Even though oil prices began plummeting in August 2008, the damage was done. U.S. consumers turned away from purchasing new cars, particularly the less fuel-efficient models produced by U.S. domestic carmakers. As a result, the carmakers reduced their production and began massive layoffs, which affected every level of this industry.
On a side note, we'll also note that the worsening employment situation in the U.S. has largely affected men, who are disproportionately more likely to be employed in the sectors of the economy most affected by these changes (see Mark Perry's latest data on what he calls the "Man-cession.")

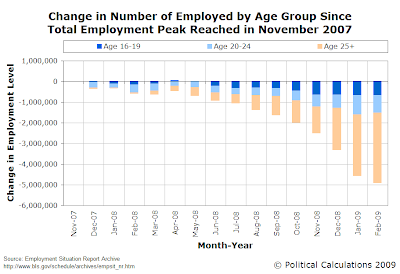
This chart is slightly different than the others we presented earlier in that we're showing the Age 16-19 group, but have broken the Age 20+ employed population of the U.S. into the Age 20-24 group and those Age 25+.
Here, we confirm that the bulk of jobs that have disappeared from the U.S. economy since October 2008 has been in the Age 25+ group. What's more remarkable though is the apparent stabilization of the net disappearance of jobs held by teens and young adults. While the Age 16-19 net job disappearances have held level since November 2008, we see that net job disappearnces for the Age 20-24 group continued growing until peaking in January 2009, then unexpectedly declined in February 2009.
We believe this relative improvement for both age groups is largely driven by their lack of exposure to the current employment fallout affecting the auto industry. We would however anticipate that job losses for those Age 16-19 and Age 20-24 will resume increasing as we near the next scheduled increased in the federal minimum wage in July 2009, as individuals within these two age groups are disproportionately employed at these wage levels.
Labels: demographics, economics, minimum wage
Welcome to the blogosphere's toolchest! Here, unlike other blogs dedicated to analyzing current events, we create easy-to-use, simple tools to do the math related to them so you can get in on the action too! If you would like to learn more about these tools, or if you would like to contribute ideas to develop for this blog, please e-mail us at:
ironman at politicalcalculations
Thanks in advance!
Closing values for previous trading day.
This site is primarily powered by:
CSS Validation
RSS Site Feed
JavaScript
The tools on this site are built using JavaScript. If you would like to learn more, one of the best free resources on the web is available at W3Schools.com.